An idea to make your own
Product & LinkedIn Infographics: AI Design Prompts
Create an infographic around a clear structure: comparison, sequence, categories or a short explanation. The coffee card uses four equal panels so readers can compare sensory descriptions.
Start creating Explore the examples ↓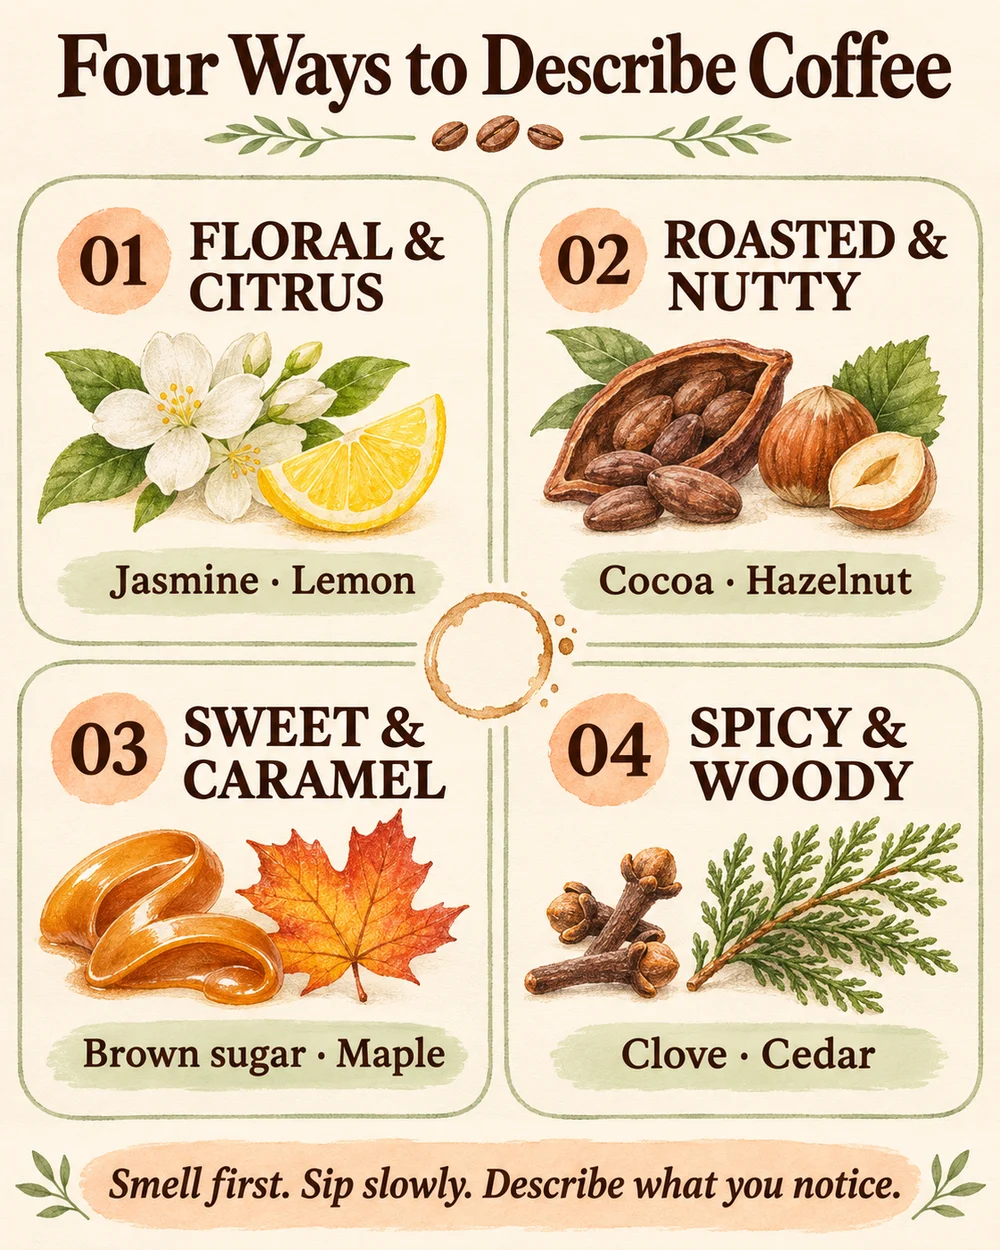
Bring the essentials
- Topic
- Approved facts
- Relationship
Choose a visual direction and adapt the description before generating. Turn on optional design refinement if you want help with composition, colors or layout. Keep your facts and exact wording in the brief.
Choose the relationship first
A timeline, a process and a category list need different layouts. Explain what the reader should compare or understand. Supply the underlying facts and labels before asking for a visual treatment.
Check the data in the image
Verify every number, unit, label and ordering against the source. Generated artwork is useful for presentation, but it does not make an unsourced statistic reliable.
See the idea take shape
Explore the image. Open the prompt. Change the details that make it yours.
Four ways to describe coffee
Original AI-generated example.
See the exact prompt
Create ONE beautifully clear finished flat 4:5 educational infographic for a fictional coffee tasting lesson. Cream background, dark espresso type, muted apricot and sage accents, tactile watercolor-and-pencil food illustrations. Title at top exactly 'Four Ways to Describe Coffee'. Four equal spacious panels in a two-by-two grid around a small tasteful central coffee-ring motif. Each panel has one large numbered heading, one small illustration and one concise text line. Exact text: '01 FLORAL & CITRUS' / 'Jasmine · Lemon'; '02 ROASTED & NUTTY' / 'Cocoa · Hazelnut'; '03 SWEET & CARAMEL' / 'Brown sugar · Maple'; '04 SPICY & WOODY' / 'Clove · Cedar'. Corresponding illustrations of jasmine and a lemon wedge; cocoa beans and a hazelnut; a caramel ribbon and maple leaf; clove and a cedar sprig. Readable words, flawless numbering and unambiguous grouping. Bottom sentence exactly 'Smell first. Sip slowly. Describe what you notice.' Avoid nutrition, medical or scientific measurement claims. No extra text, watermark, AI label, frame or mockup. Make this an appealing learning card someone would save.
A few useful answers
Can I include a chart?
You can request an illustrated chart, but numerical accuracy and proportional marks need verification. Use a data-chart tool when exact plotting is essential.
Can I make a learning card with no statistics?
Yes. Categories, examples and short steps can work well when the reading order is clear.
Keep exploring
All ideas ↗
AI Image Generator for Photos, Memes & Design
AI images for an idea worth making.
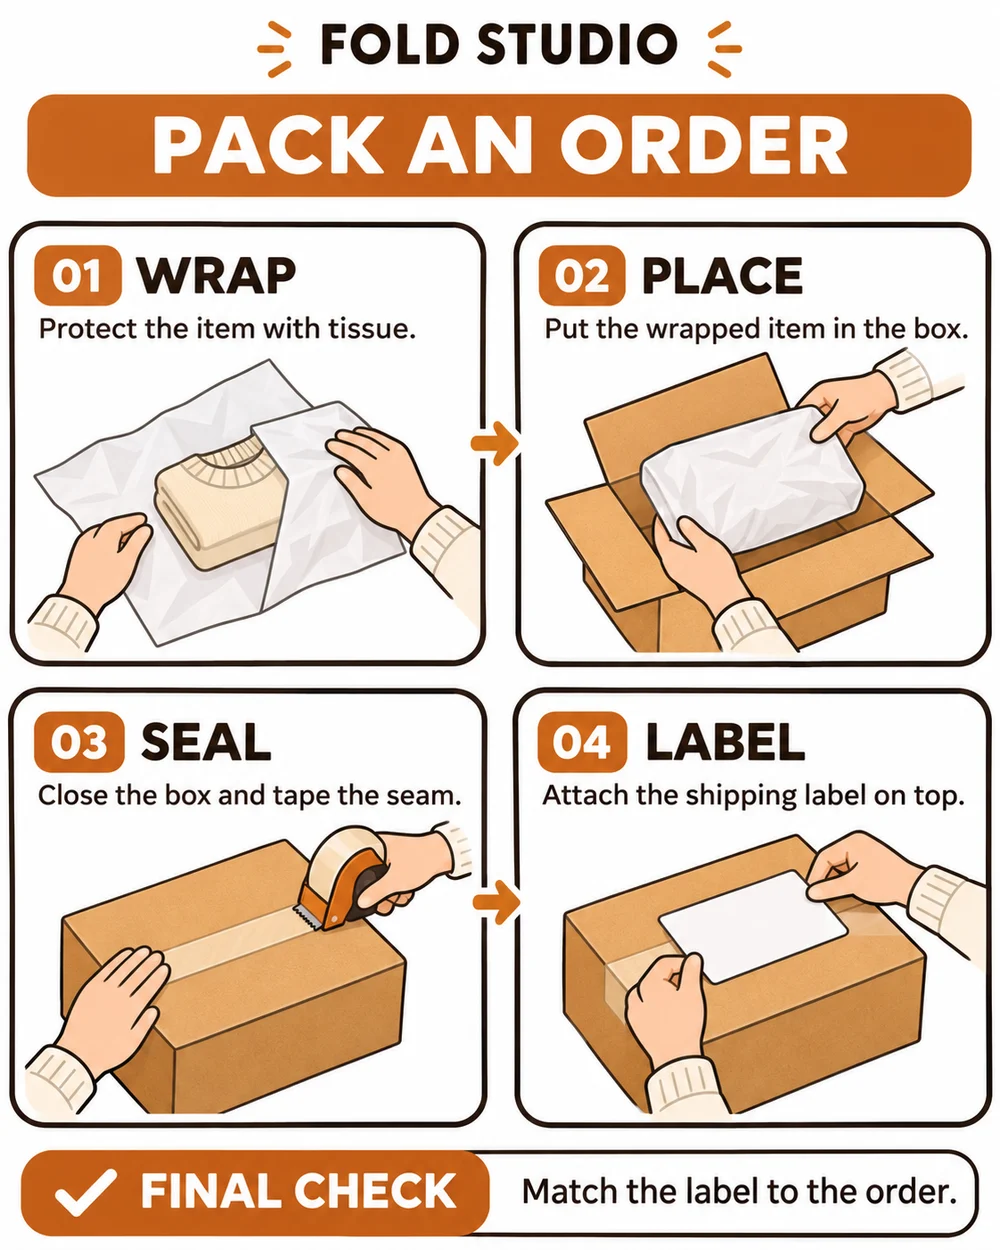
Visual Instruction Guides: Steps & AI Prompts
Turn a short procedure into a visual guide.
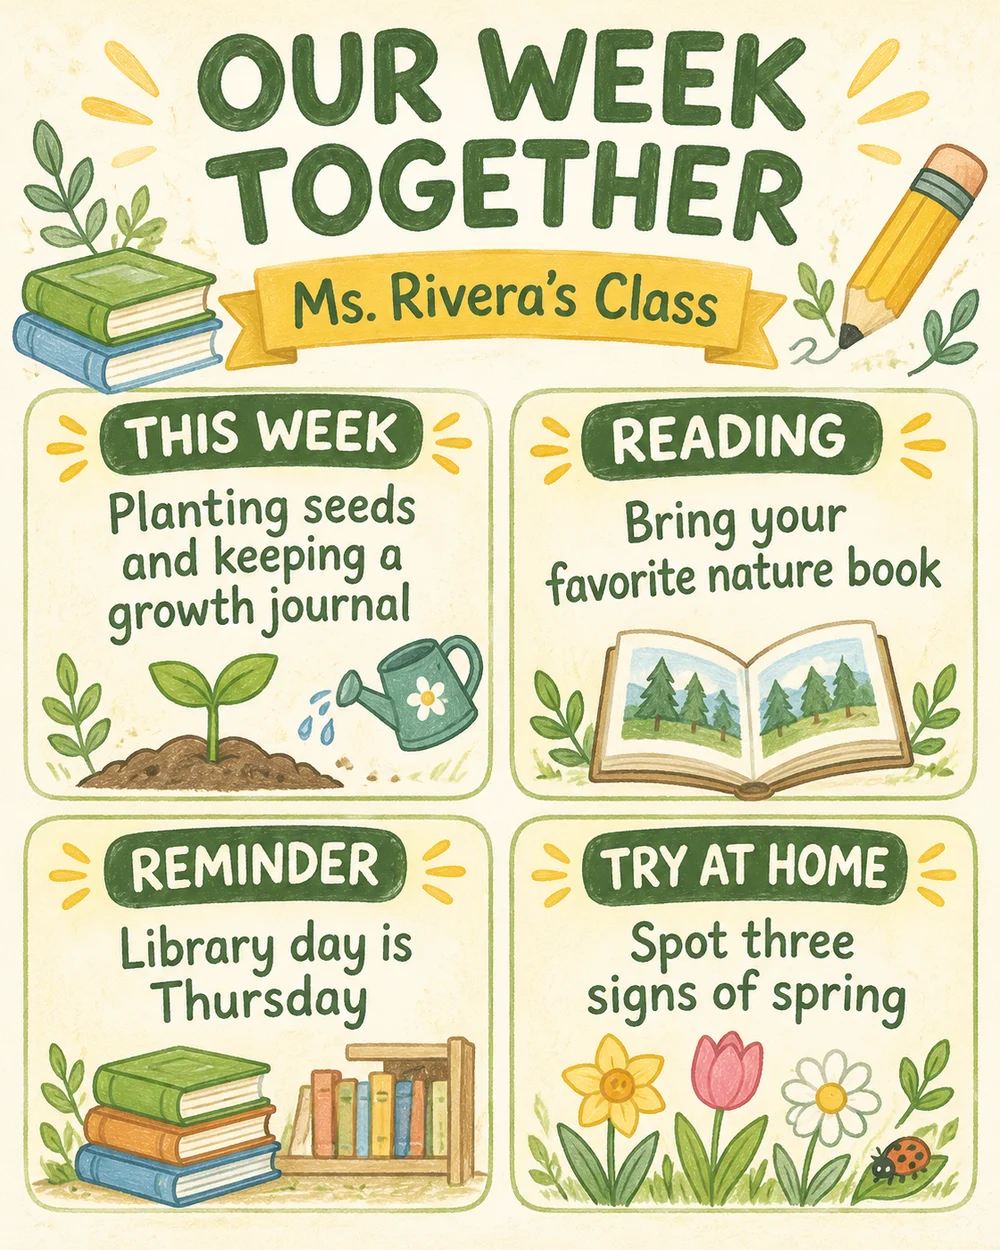
Classroom Newsletter Design: Examples & Prompts
Give families the week's useful highlights.

Sermon Series Graphics: Cover Ideas & Prompts
Give the series a coherent visual theme.